Stakeholder Onion Diagram
What is it?
The Stakeholder Onion Diagram is a way of visualizing the relationship of stakeholders to a project goal. Additional information can be included that shows relationships among stakeholders to each other or to specific layers
of the project. But the main difference that sets the onion diagram apart is that is focuses on the project goal at the center, not the project itself or key stakeholders.
A Stakeholder Onion Diagram is usually made up of 4 or 5 layers. From the center out, these layers represent:
- The Product or Solution
- The Business System
- The Business
- The Environment
- If used, the outer layer can be used for stakeholders who do not map to any other layers.
However, these are merely suggestions and the project team can add or remove layers as they feel necessary.
Why do it?
The Stakeholder Onion Diagram is useful in that it maps stakeholders relationship to the final product or deliverable of a project, rather than on the basis of power, influence, support, or other metrics. It's useful in that it can help show the importance of stakeholders with little power or influence, but who will be important to the success of the final product.
How do I do it?
Step 1
Draw the center (smallest) circle. This represents the product or solution that is being delivered by the project. Note that at the beginning this can be a bit fuzzy if the final goal or even scope have not been defined yet. That's OK as you can refine the diagram later as you gain more knowledge.

Step 2
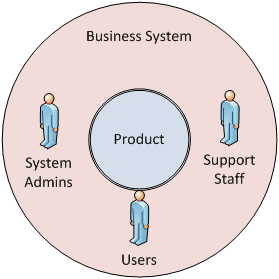
Draw the 2nd layer (the next circle). This represents the Business System and entails not just the final product, but those stakeholders who interact directly with it. Add stakeholder roles to this circle to indicate who those stakeholders are that interact directly with the solution.

Step 3
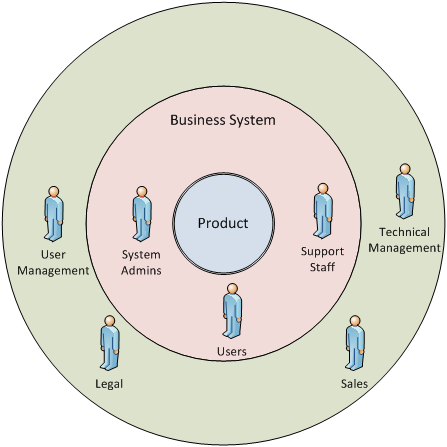
Add the 3rd layer of the diagram (the next circle). This layer represents the business or organization that hosts, controls, or generally controls the project solution. This layer of the onion diagram is populated with what Ian Alexander calls the "functional beneficiaries" of the system. [1] These are the other stakeholders within the organization who may not interact directly with the solution who benefit from it. Add these stakeholders within the 3rd layer to get a result similar to that below.

Step 4
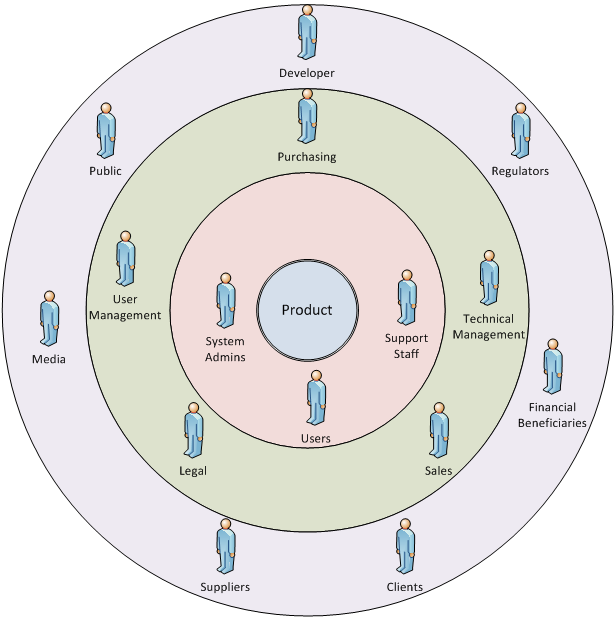
Add the 4th layer (the next circle). This layer represents the wider environment in which the firm operates. This layer is populated with stakeholders who are outside the firm but who are still important. These include regulators, clients, suppliers, financial beneficiaries such as stockholders, the public (if there is a public impact), the media, the similar entities. It is important to note that most of the project team, including developers would likely be contained in this last circle. Although they are often within
the firm, they are usually not functional beneficiaries of the solution and are not usually involved in ongoing maintenance and operations of the solution. If any of the project team can be considered functional beneficiaries or will be involved in ongoing operations or maintenance, they should be located within one of the 2nd or 3rd rings of the onion. This results is a diagram similar to the one below.

Step 5
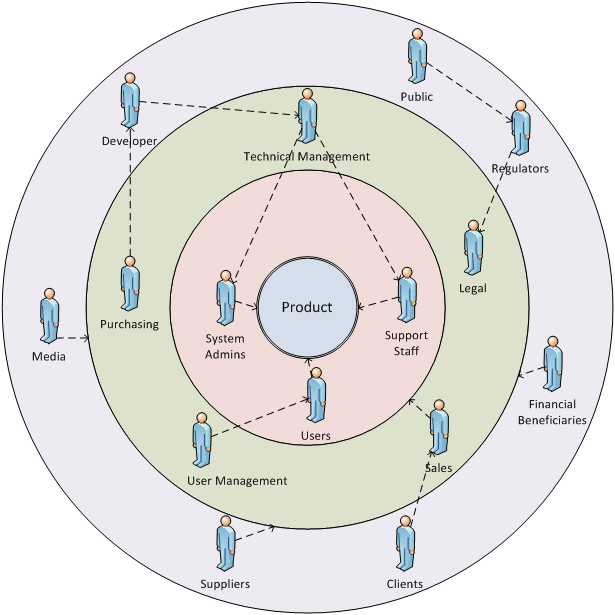
At this point, a basic onion diagram contains a fair amount of information. The last step is to add relationship arrows to the diagram. These are usually displayed as dashed lines with a direction indicator showing the direction of relationship. Stakeholders can have relationships with the previous layer of the diagram, or with other specific stakeholders.

Additional Steps
Optionally, you can take additional steps to increase the amount of information. Among the various options are:
- You can color-code stakeholders based on their attitude towards the project.
- You can color-code the relationship arrows to indicate negative relationships (red arrows), or strong relationships (thicker or bold arrows).
- You can use bold labels for those stakeholders who are particularly powerful or important for the project.
- You can insert additional layers if you want a more detailed view of the different layers within the firm or if you want to separate the "Wider Environment" level into those that interact directly with the firm and those that don't.
What Should the Results be?
As with most diagrams created as part of stakeholder analysis, the greatest benefit is frequently the analysis that goes into creating the diagram, rather than the diagram itself. However, the onion diagram provides a perspective on the project stakeholders that is frequently ignored by other stakeholder diagramming techniques.
Risks
- Because Onion Diagrams focus on a stakeholders relation to the solution, it can sometimes be easy to mistake that relationship to the solution with overall stakeholder importance.
Tips
- A relatively easy way to create Stakeholder Onion Diagrams is to use Microsoft Visio. In Visio 2010, select the General template category, and then Block Diagram. You can then use the Concentric Center and Concentric Layer shapes to build out your diagram. Note that although Visio pre-defines up to 3 layers (beyond the center), you can add additional layers just by adding the largest size to the diagram and expanding it via the controls.
References
- Paper: Stakeholders - Who is Your System For? Ian Alexander. 2003.
- Paper: Understanding Project Sociology by Modeling Stakeholders. Ian Alexander and Suzanne Robertson. 2003.
- Paper: A Taxonomy of Stakeholders - Human Roles in System Development. Ian Alexander. 2005.
Related Resources
- Article: Create an Onion Diagram in Visio 2007, on the Office.com site from Microsoft.
- Blog Post: Peeling the Onion. M. Murphy. On the Seilevel Software Requirements Blog. 2007.
- Blog Post: How to Visual Stakeholder Analysis. Scott Sehlhorst. On the Tyner Blain blog. 2007.
- Article: Rainbow and Onion Diagrams. In the Campaign Planning - Stakeholder Analysis section of the UN End Violence Against Women & Girls web site.
- BABOK Guide v2 - Section 2.2.5.3: Stakeholder Map, and Figure 2-6: Stakeholder Onion Diagram