Matrix Prioritization
IMPORTANT! If you are going to use any prioritization method, be sure that you actually implement more than just the highest level of priority items. If stakeholders consistently see that all that will implemented are the highest priority items, then soon they will stop believing that priority levels mean anything and that everything that is not flagged as the highest priority will not get implemented. And if that occurs, then either everything your clients prioritize will be the highest priority or they simply will no longer cooperate because they have lost confidence in the process.
Also known as: Prioritization Matrix, Wiegers Prioritization Matrix, Wiegers Prioritization Method, Prioritization Matrix according to Wiegers
What is it?
Matrix Prioritization is a general-purpose multi-factor prioritization technique that results in a ratio-scale output. The concepts behind it can be traced back to work done on Quality Function Deployment (QFD) and Total Quality Management (TQM) among others, and there are several variations in how the technique can be executed. The most common implementation of this technique among Business Analyst's is probably Wiegers Prioritization Matrix (WPM hereafter for brevity).[1] It is also very similar to the Decision Matrix technique (aka Problem Matrix, Solution Matrix), but instead of resulting in a single preferred outcome the Matrix Prioritization technique results in a list of all evaluated items ranked by priority.
Matrix Prioritization efforts are made up of five different components, which are:
- Item Set - The items that are being evaluated for the prioritization effort
- Criteria - The varying criteria that will be used to evaluate each item. All criteria apply to all items.
- Value Scales - These are the scale of possible values that can be used to specify the relationship of an item to the criteria being evaluated
- Weightings - The relative weighting applied to each criteria
- Formula - The formula selected to generate a priority value for each item based on the Criteria and Weightings
These components are described in more detail below.
Item Set
Matrix prioritization can be applied to any set of items that can all be evaluated by a consistent set of criteria. This can include:
- Projects
- Features
- Functions
- Goals
- Solution Options
- Requirements
- Almost anything else that needs to be prioritized
In addition to being able to be rated on a consistent set of criteria (consistent among all of the items rated, not every time you need to prioritize a set of something), the items should all be at the same level of abstraction so that the rating evaluations are all made using the same approximate level of information.
Additionally, Karl Wiegers recommends that if specific items in your set are dependent (for example, if you would only consider item X if item Z was included), include only the driving item in the analysis. However, you could also deal with dependency issues by assigning a dependency criteria to the analysis process for each item that indicates the level of dependency of that item on other items in the set. An example of this is included in the How do I do it?
section below.
Criteria
The Criteria you use for Matrix Prioritization should be relevant to all of the items in your evaluation set. There should be more than one criteria (preferably 3+ to get the most benefit from this process).
The criteria can be anything you feel appropriate for evaluating the items to be prioritized. However, the following list has some of the common criteria mentioned in the literature:
- Relative Benefit (to the business, customer, revenue etc.) [1, 2]
- Relative Penalty (if not included) [1, 4]
- Relative Cost (of implementation)[1, 4]
- Relative Risk (of Implementation, relative to the Cost) [1, 4]
- Relative Importance / Criticality (to success, to meeting regulatory needs, etc.) [2, 4]
- Degree of Tactical / Strategic Alignment (how well does the item match up to tactical or strategic goals of the organization) [2]
- Time to Implement [3, 4]
- % of Users Impacted [3]
- Amount of Resources Required (to implement)
- Volatility (potential for item to change, or potential for rating to change) [4]
- Urgency (how soon is the item needed?)
Note that for many of the criteria above you may consider more than one variant. For example, when looking at Relative Benefit, are you considering the benefit to a primary customer such as a purchaser, secondary benefits such as to the manufacturer, benefits to specific internal departments such as benefit to Marketing, or to other groups? Depending on the goal of your prioritization effort, it might actually be a good idea to evaluate the potential benefit to different groups as separate evaluation criteria.
You can also select multiple criteria to look at prioritization in specific aspects. For example, if you were focused on getting as much functionality built in as short of time as possible, you could be evaluating items based on a combination of Cost, Risk, Time to Implement, and Amount of Resources required to implement.
Whatever the criteria you choose, you should ensure that you document a definition for the criteria and gain stakeholder consensus on that definition.
Value Scales
Value Scales are used to rate each item in regards to a single criteria. The most common scale seems to be from 1 to 9 [1, 2, 5], but from 0 to 5 is also used[4], and no doubt others. The key things to consider with the value scale are:
- The number of options should be relatively small. A wide range of options tends to lead to debate over small differences.
- Each value in the scale should be associated with a relatively-specific definition of what that value means in the context of the criteria being evaluated.
For example, see the example below:
Relative Benefit
- 0 = No users would find this feature useful
- 1 = This feature would be somewhat useful to a small number of users
- 2 = This feature would be somewhat useful to many users
- 3 = This feature would be useful to many users
- 4 = This feature would be very useful to some users in stakeholder groups
- 5 = This feature would be very useful to many users, including those in all stakeholder groups
Ideally, you should try to define specific criteria for deciding what a specific value means
for a given category, and get stakeholder buy-in, that will make the evaluation process go more smoothly. This is especially true for things like Implementation Effort
or Cost
, where it is easier to use specific numbers for each potential value. Currency amounts, man hours, or number of resources are probably the best options for these types of value scale. For example: 0 = 0-50 man hours, 1 = 51-150 man hours, etc.
For simplicity, you might decide to use only specific values within the range you select. For example, if you use a range of 1 to 9, you might limit the choices to just 1, 3, 6, and 9. This limited set of choices with a wider separation between the available digits will give the selected values more impact when prioritization values are calculated.
Weightings
Weightings allow you to prioritize certain criteria higher than other criteria. Or if you are tracking separate ratings from multiple stakeholders, you can weight stakeholders as well so that some have greater influence than others over the outcome.
Wiegers gives the simple example of weighting benefits twice as much as penalties, with benefits thus getting a weighting of 2 and penalties 1. An alternate approach is that suggested by Landau [3] of using percentages and ensuring that the weightings for all criteria sum up to 100%.
The idea is that criteria that are more important are given a higher weight so that they have a greater impact on the prioritization calculation than the might just using the basic value scales, without having to have several value scales for the same criteria.
Formula
There is no standard
formula used for Matrix Prioritization. And although Karl Wiegers provides a formula for use with his specific version of this technique, I get the impression from his writings that even that formula is more of a suggestion than a hard and fast rule. So one of the key activities when using the Matrix Prioritization technique is to define a formula that you will use in the process.
Basically, the formula should be tailored to the criteria you are using and the general focus of your evaluation. Are you weighing up just the Pros
? Are you weighing the Pros vs. Cons
? If so, are you subtracting the Cons from the Pros, or dividing the Pros by the Cons? Or something else?
Sometimes all that is needed is to sum up all of the weighted criteria values for each row of the matrix [2, 3]. Sometimes you may want to do more complex calculations. For example, for WPM, Wiegers' uses the formula of: Priority = (Weighted Benefit % + Weighted Penalty %) / (Weighted Cost % + Weighted Risk %). Note that Wiegers converts the values in his process to percentages, and uses the percentages to calculate the final priority value.
Other options include the idea of providing a confidence or volatility rating for any implementation-specific ratings such as cost, risk, resource requirements, and similar values. This would let your implementation team say that they think cost is probably a 5
(whatever that means for your rating scale), but their confidence in that rating remaining true through implementation is only a 1. If you treat the confidence value as a percentage (so a rating of 1 means only 10% confidence) and multiply the two values together, the higher confidence items receive a higher priority.
Just as with the criteria, weighting, and rating scales, the idea here is to come up with a formula that all parties agree to. Just don't make it too complex. Matrix prioritization is not meant to generate high-confidence results, it's meant to allow you to prioritize across multiple criteria in a way that generates structured and useful results.
Why do it?
See the Prioritization wiki page for a discussion of why to prioritize (in general).
The main benefit of the Matrix Prioritization technique is that unlike virtually every other prioritization technique, it explicitly evaluates each item across several criteria (or contexts in the language used on the prioritization wiki page) rather than the single context that other prioritization techniques work on.
Another benefit is that if Matrix Prioritization is done with a spreadsheet that auto-calculates the priority values, it becomes very easy to conduct what-if
scenarios to improve the results and to test various scenarios with stakeholders. What-if
scenarios are basically changes to values, weightings, or the formula to explore how the results change if various inputs to the formula are changed (i.e. what if Cost is weighted at twice its stated value instead of at its stated value, how does that change our priorities?
).
How do I do it?
The step-by-step instructions below are actually going to go through two examples concurrently. One will follow the standard Wiegers Prioritization Matrix (WPM) process, and the other will show a more wide-ranging set of options. The key point is for you as the Business Analyst to understand is that while there is a single overall process or method used with this technique, the method allows for a wide-ranging set of options when you actually execute a specific instance of the technique. It's up to you as the BA to work with stakeholders to define the set of options that are appropriate to your scenario. Hopefully the steps below will walk you through a detailed enough overview of the process for you to customize it to your specific usage scenario.
Step 1
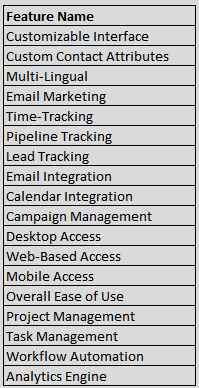
List all of the items that you wish to prioritize in a table with the items being listed in the first column. As an example, below is a list of some CRM features from various CRM vendor web sites.
Step 2
Determine the criteria that will be used for evaluating each item.
WPM Example
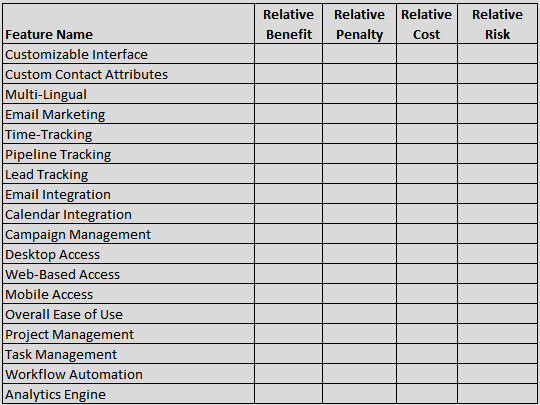
The WPM process next adds the four standard prioritization criteria. The criteria and their definitions are listed below:
- Relative Benefit - The relative benefit the feature provides to the customer or business if implemented
- Relative Penalty - The relative penalty that the customer or business would suffer if the feature was not implemented
- Relative Cost - The relative cost of implementing the specific feature
- Relative Risk - The relative degree of technical or other risk associated with implementing the feature
This results in the matrix looking something like this:
Non-WPM Example
For the non-WPM example, the prioritization criteria we will use are:
- Relative Benefit - The relative benefit the feature provides to the customer or business if implemented
- Relative Penalty - The relative penalty that the customer or business would suffer if the feature was not implemented
- Volatility - How much might our understanding of what an implementation this feature would look like might change?
- Urgency - How urgent is it that this feature be implemented and in use by the stakeholders?
- Criticality - How important is this feature for achieving the overall goal of the effort?
- Implementation Effort - How much effort does the implementation team think it will take to implement this feature?
- Implementation Confidence - How confident is the implementation team that their Implementation Effort value is accurate?
- Dependency Risk - The relative degree of technical or other risk that implementing this feature has on other features.
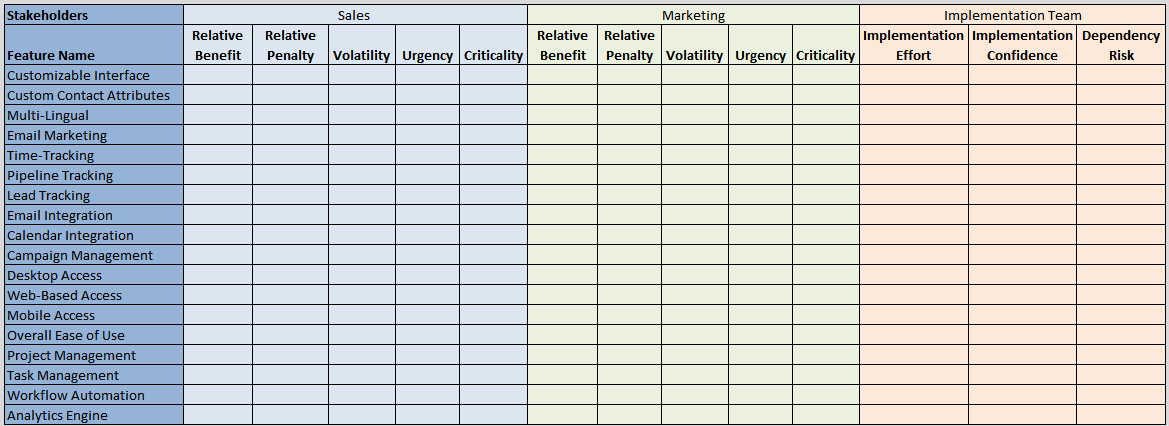
In addition to using a different set of criteria for the Non-WPM example, this example set also demonstrate how you can use Matrix Prioritization to include more than just a single consensus value rating for each criteria by supporting value inputs from two different stakeholder groups (in addition to the implementation team). They will be a Sales
stakeholder and a Marketing
stakeholder for purposes of the example.
Note how in the updated table below the criteria columns that receive values from the business
(or users, or whatever) are duplicated, one for each stakeholder group.
Step 3
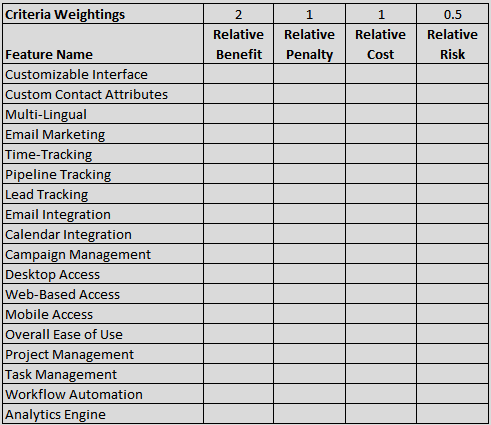
Determine the Weightings you will apply to each criteria. In all of the references I cite below, the Weightings value is added above the Criteria, as shown in the WPM example below. However, I show an alternate method for including the Weighting in the Non-WPM example.
WPM Example
There are no specific weightings prescribed by the WPM process. However, they are supported and described by Wiegers as an additional option in the description of Step 4
in his original paper.
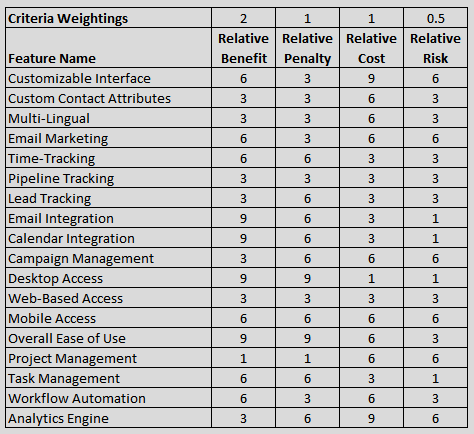
For this example, we will use the same weightings Wiegers used in Table 2 of his original paper. They are: Benefit to Customer is weighted twice as high (2) as Penalty to Customer (1) and Estimated Cost (1), while Relative Risk is weighted at only half the value of Estimated Cost (0.5).
The example table for WPM has now been updated to look like this:
Non-WPM Example
While all of the references I cite below (and that I have seen) indicate that the weighting value is usually added above the criteria column header, I prefer to put the Weightings in their own columns as shown below. The reason I prefer an in-line weighting value is that it lets you capture values for multiple stakeholders who might have different weightings for the same features or to weight specific items differently for a criteria than other items for the same criteria. This has the downside of making the matrix much larger (depending on how many Weighting values you use).
There are several things to call out about the example table below that give you examples of the flexibility this approach provides:
- Features that are considered more
Sales
centric, such as Pipeline Tracking, are weighted heavier for Sales than for Marketing (2 vs 1) for the Benefit criteria. And the same thing is done for features that are moreMarketing
oriented, such as Campaign Management, for the Marketing stakeholder (again, 2 vs 1). - The Benefit column for some features are weighted the same for both stakeholders where they are not
core
to their needs, such as the Project Management feature (weighted a 1 for both). - The weightings for several Criteria (Penalty, Volatility, and Criticality) are all set to 1. You could easily drop these columns and any other columns where the weights are all
1
values, depending on the formula you use. An example of this is the absence of a weighting column for theImplementation Confidence
criteria. I often include them because it makes them easy toplay
with when doingWhat If?
scenarios. - Because
Sales
has a greater need for the CRM, their Urgency weighting is set to 2, while Marketing is set to 1. - The Effort weighting has been set to 2 in order to more heavily weight the work necessary to implement a feature.

Step 4
After selecting criteria and weightings, the next step is to select a rating scale.
WPM Example
For the WPM example we will use the 1 to 9 scale with a restricted range of 1, 3, 6, and 9. For each of the criteria, the following are guides to stakeholders for selecting the correct rating value.
Relative Benefit
- 1 = No users would find this feature useful
- 3 = Some users would find this feature useful
- 6 = Some users would find this feature very useful
- 9 = Many users would this feature very useful
Relative Penalty
- 1 = No users would be upset if this feature was absent
- 3 = Some users would be upset if this feature was absent
- 6 = Some users would be very upset if this feature was absent
- 9 = Many users would be very upset if this feature was absent
Relative Cost
- 1 = It would be quick, easy, and low cost to implement this feature
- 3 = It would be moderately easy and middling cost to implement this feature
- 6 = It would moderately difficult and expensive to implement this feature
- 9 = It would be very difficult and very expensive to implement this feature
Relative Risk
- 1 = This feature could be implemented as requested with almost no risk of change or delay
- 3 = There are minor concerns that this feature could be feasibly implemented as requested within the project timeline
- 6 = There are significant concerns that this feature could be feasibly implemented as requested within the project timeline
- 9 = There are very serious concerns that this feature could be feasibly implemented as requested within the project timeline
Non-WPM Example
For the Non-WPM example, we will use the 0 to 5 scale with an unrestricted range. For each of the criteria, the following are guides to stakeholders for selecting the correctly rating value.
Relative Benefit
- 0 = No users would find this feature useful
- 1 = This feature would be somewhat useful to a small number of users
- 2 = This feature would be somewhat useful to many users
- 3 = This feature would be useful to many users
- 4 = This feature would be very useful to some users in stakeholder groups
- 5 = This feature would be very useful to many users, including those in all stakeholder groups
Relative Penalty
- 0 = No users would be upset if this feature was absent
- 1 = Some users would be upset if this feature was absent
- 2 = Some users would be very upset if this feature was absent
- 3 = Many users would be slightly upset if this feature was absent
- 4 = Many users in stakeholder groups would be upset if this feature was absent
- 5 = Many users in stakeholder groups would be very upset if this feature was absent
Volatility
- 0 = This feature is not well understood or defined at all, and is very likely to change substantially if implemented now
- 1 = This feature is only slightly understood or defined, and is likely to change substantially if implemented now
- 2 = This feature is only moderately understood or defined, and is somewhat likely to change substantially if implemented now
- 3 = This feature is moderately understood or defined, but is similar to existing features is unlikely to change substantially if implemented now
- 4 = This feature is well understood or defined, and is not likely to change substantially if implemented now
- 5 = This feature is extremely well understood or defined, and is highly unlikely to change substantially if implemented now
Urgency
- 0 = This feature is not needed soon and implementation could be delayed indefinitely without impacting stakeholders
- 1 = This feature is not needed soon and implementation could be delayed until an unscheduled future release without impacting stakeholders
- 2 = This feature is not needed soon and implementation could be delayed until a defined release late in the project plan without impacting stakeholders
- 3 = This feature is needed relatively soon and implementation cannot be delayed substantially without impacting stakeholders
- 4 = This feature is needed soon and implementation must happen close to the time-frame requested without impacting stakeholders
- 5 = This feature is needed very soon and implementation should happen as soon as possible or stakeholders will be negatively impacted
Criticality
- 0 = This feature is not at all critical for the overall success of the effort
- 1 = This feature is slightly critical for the overall success of the effort
- 2 = This feature is somewhat critical for the overall success of the effort
- 3 = This feature is critical for the overall success of the effort
- 4 = This feature is very critical for the overall success of the effort
- 5 = This feature is extremely critical for the overall success of the effort
Implementation Effort
- 0 = This feature will take very little effort or time to implement
- 1 = This feature will take little effort or time to implement
- 2 = This feature will take moderate effort or time to implement
- 3 = This feature will take significant effort or time to implement
- 4 = This feature will take major effort or time to implement
- 5 = This feature will take extreme effort or time to implement
Implementation Confidence
- 0 = The Implementation Effort value for this feature is extremely likely to change by a very large amount
- 1 = The Implementation Effort value for this feature is likely to change by a very large amount
- 2 = The Implementation Effort value for this feature is likely to change by a large amount
- 3 = The Implementation Effort value for this feature is unlikely to change by a large amount
- 4 = The Implementation Effort value for this feature is very unlikely to change by a large amount
- 5 = The Implementation Effort value for this feature is very unlikely to change by even a small amount
Dependency Risk
- 0 = This feature is dependent on many features that are not well understood
- 1 = This feature is dependent on some features that are not well understood
- 2 = This feature is dependent on few features that are not well understood
- 3 = This feature is dependent on some features that are well understood
- 4 = This feature is dependent on very few other features that are well understood
- 5 = This feature is not dependent on other features in any way
Step 5
The last step in setting up the parameters of your matrix involves selecting the formula that you will use to calculate prioritization values.
WPM Example
The WPM example will use the standard formula for Wiegers Prioritization Matrix, which is:
Priority = (Weighted Benefit % + Weighted Penalty %) / (Weighted Cost % + Weighted Risk %)
Non-WPM Example
For the Non-WPM example, I will use a slightly more complex formula given the greater number of items. The general idea will be to add up the business needs
and divide it by the implementation costs & concerns
using the following generic formula:
Priority = (Sales Business Needs) + (Marketing Business Needs) / (Implementation Costs & Concerns)
The Volatility values and weightings for both Sales and Marketing are considered concerns
in this case because the uncertainty they imply could impacts implementation costs and effort. As such they are moved to the divisor. The overall idea is then implemented using the following long formula in Excel.
Priority = ((for Sales Stakeholder ((Relative Benefit*Benefit Weight)+(Relative Penalty*Penalty Weighting)+(Urgency*Urgency Weighting))+(Criticality*Criticality Weighting))+(for Marketing Stakeholder (Relative Benefit*Benefit Weight)+(Relative Penalty*Penalty Weighting)+(Urgency*Urgency Weighting))+(Criticality*Criticality Weighting)))/((Sales Volatility*Weighting)+(Marketing Volatility*Weighting)+((Implementation Effort*Weighting)*Implementation Confidence)+(Dependency Risk*Weighting))
Step 6
Now that the Matrix is set up, the next step is to apply rating values to each item for each criteria. A few guidelines for this activity include:
- Ratings are applied without factoring in Weightings. This preserves the original rating if weightings need to change.
- If only tracking ratings for one overall group, it's best to do this with the project team and business stakeholders as a group.
- If tracking ratings for more than one group of stakeholders, it's best to have them assign their (initial at least) criteria ratings separately from each other, and without knowledge of the other stakeholders ratings. This helps prevent one stakeholder groups ratings from influencing another groups.
- For implementation-specific ratings for things like cost and risk, there are arguments for doing them after stakeholders have done their ratings (to get actual stakeholder ratings without the impact of cost or effort) and for doing them before stakeholders have done their ratings (so that stakeholders can consider factors such as cost and risk in their ratings). You can even do both if you feel it's appropriate (one without implementation information, then a follow-up with it).
WPM Example
The table below shows the matrix up to this point with the value ratings populated for each item and each criteria.
Non-WPM Example
The table below shows the matrix up to this point with the value ratings populated for each item and each criteria.

Step 7
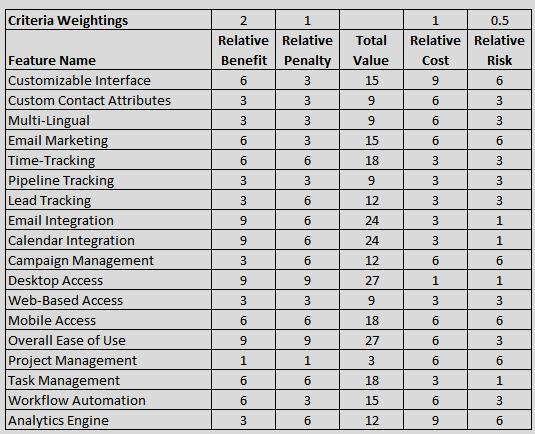
If your matrix displays any calculated values (such as the Total Value
column in Wiegers Prioritization Matrix), you calculate them in this step. These values will normally incorporate the impact of any weighting.
Of course, a best practice here is to do Matrix Prioritization in something like an Excel (or LibreOffice Calc, or a similar spreadsheet) and to have built the formula's into the spreadsheet ahead of time. Using a spreadsheet should reduce the chance of calculation errors throwing off your final values.
WPM Example
The table below shows the matrix up to this point with the addition of the Total Value calculated column values.
Non-WPM Example
For simplicities sake the Non-WPM example will not display any calculated columns other than the final priority.
Step 8
If your formula and / or Matrix require or display percentage values, you calculate them in this step. The percentage values are typically (certainly in WPM) the percentage that the specific row value is of the total of all values in that column.
WPM Example
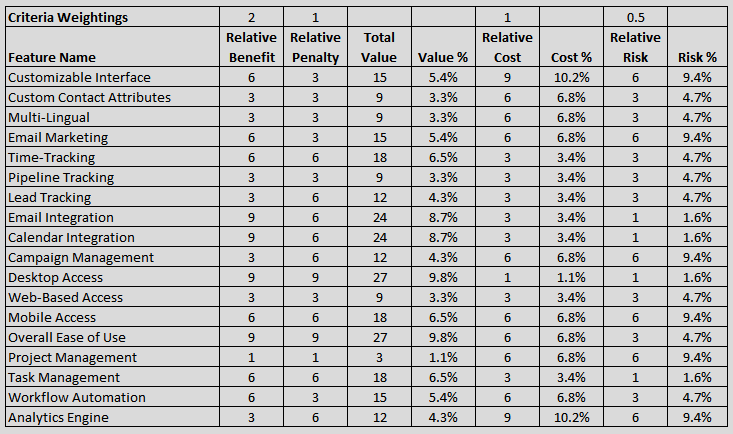
Non-WPM Example
For simplicities sake this example will not display any percentage columns.
Step 9
Based on the formula you specified, calculate the priority values. Again, if you have built the formula into a spreadsheet, this will already be done for you as you populate the rest of the spreadsheet.
WPM Example
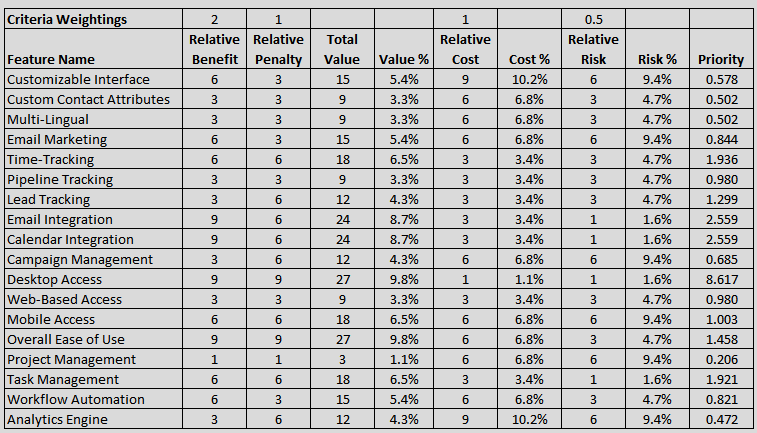
Non-WPM Example

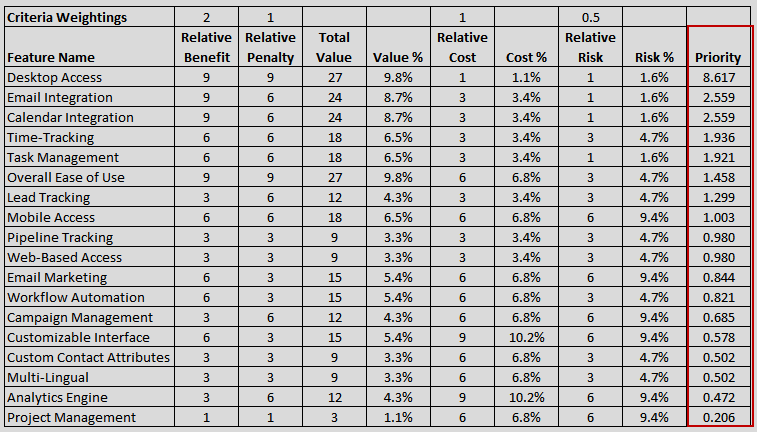
What Should the Results be?
After sorting the items in the list from highest priority to lowest, you get the following final results.
WPM Example
Non-WPM Example

Advantages
- Ability to asses priority across multiple criteria or context areas
- The ability to remove some subjectivity from the priority rating
- The ability to explore
what if
scenarios by changing values
Disadvantages
- The limitation of the technique is that it is dependent on user subjective evaluations and as a result the outputs of the technique should be used a prioritization guide and further evaluated by the evaluation team to confirm they are appropriate. However, this is common issue with all prioritization techniques that I am aware of and so should not dissuade readers from considering this technique.
- Per Karl Wiegers,
This model will work with up to several dozen [items] before it becomes unwieldy. If you have more items than that, abstract related [items] together to create a more manageable initial list. You can do a second round of analysis at a finer granularity if you need to.
[1]
Tips
- Definitely use Excel or other spreadsheet program for Matrix Prioritization. The ability to leverage formulas, cell colors, conditional formatting, and other controls over the display of information make the matrix prioritization process much more efficient, understandable, and enjoyable.
- If using a spreadsheet and you have the weightings in their own columns (as shown in the Non-WPM example), you can hide those columns once they are initially filled if it will help stakeholders better read the matrix.
References
- Article: First Things First - Prioritizing Requirements. By Karl Wiegers. On ProcessImpact.com. 1999.
- Article: Project Prioritization - A Structured Approach to Working on What Matters Most. By Carol Gosenheimer. Office of Quality Improvement. University of Wisconsin - Madison. 2012.
- Blog Post: Forced Ranking of Product Features in a Spreadsheet. By Nathaniel Landau. On his personal blog. May 10, 2013.
- Book: Requirements Engineering Fundamentals - A Study Guide for the Certified Professional for Requirements Engineering Exam Foundation Level. By Klaus Pohl and Chris Rupp. 2011. Rocky Nook, Inc. Pgs. 121-122
- Book: Software Requirements, Third Edition. By Karl Wiegers and Joy Beatty. Microsoft Press. 2013. Pgs. 322-327
Related Resources
- Article: Prioritization Matrix. By Work Systems Affiliates International, Inc. On their web site. Undated.