Investment Logic Mapping
What is it?
An Investment Logic Map (ILM) is a single-page depiction of the logic that underpins an investment. It represents an ‘agreed investment story’ that is logical, able to be supported by evidence and easily understood by a layperson.[2] It is designed around the idea that all potential investments, regardless of size or complexity, should follow the same ‘line of inquiry’ to develop their respective investment story.[4]
It is created as part of efforts to determine if a potential investment (in the form of a project, purchase, or other initiative) is worth further investigation by the organization. As such it acts as an initial hurdle for initiative viability and is done before a formal project is initiated, before a business case is created, and before any sort of project charter is created.
Essentially, the ILM is created in order to answer four fundamental questions: [11]
- What is the problem that is driving us to consider a new investment (both the cause and effect)?
- Is there evidence to confirm both the cause and effect of the problem?
- Is the operating environment characterised by uncertainty that could significantly impact the cause, effect, likelihood or severity of the problem or the need or demand for change?
- What benefits can the organisation expect in successfully responding to the problem?
It is important to note that this is a departure from the way many (most?) investment decisions are made. Most of the time the investment decision logic follows this pattern:
- What is the benefit we want?
- What are the impediments preventing us from realizing the benefits?
- What investments do we have to undertake to remove the impediments?
The Investment Logic Map can be used to tell an investment story at different conceptual levels. The Investment Management Standard specifically identifies using the ILM to tell investment stories at the following levels:[11]
- Organizational-level initiatives
- Program-level initiatives
- and, individual Project-level initiatives
Structure
An Investment Logic Map is a single-page diagram that is made up of up to five columns. The columns vary depending on the entity the Investment Logic Map is being created for, but are always selected from among the following: [4]
- Drivers/Problems: Identify the reason for undertaking an investment. These should generally be EXTERNAL pressures or forces outside the control of the organization. In some versions of the IMS, ‘Drivers’ are referred to as ‘Problems’, however I find ‘Drivers’ to be a better term because it can include the idea of opportunities or other factors, not just problems.
- Benefits: The benefits that will be accrued to the organization by responding to the Drivers. Benefits are defined as
The value that the investment will provide to the organization or its customers. Each claimed benefit must be supported by key performance indicators (KPI’s) that demonstrate the investment’s specific contribution to the identified benefit.
[2] - Responses: The possible strategic interventions that could be undertaken to deliver the identified key performance indicators. A valid strategic intervention must have the potential to deliver some or all of the identified KPIs and their target measures. To ensure it is sufficiently high level, its implementation must also allow more than one possible solution.[2]
- Changes: The activity changes undertaken by people within the organization in order to achieve the benefits.
- Assets: The asset column represents the acquisition or implementation of an asset that is required in addition to the organizational changes in order to achieve one or more of the benefits. Assets themselves are defined as
Service potential or future economic benefits controlled by an entity (e.g. a department) as a result of past transactions or other past events. Assets may be physical (e.g. plant, equipment or buildings) or non-physical (e.g. financial investments). Assets may also be current (having a store of service potential which is consumed in one year or less) or non-current (having a store of service potential that is consumed over a period of more than one year).
The logical flow of how these concepts are linked together is best shown through the following diagram: [11]

Entries are added to the diagram for each of the five subjects above starting from the left column and progressing to the right. Each entry within a column is weighted in importance, and then relationships between the entries are specified by arrows as appropriate.
Project Management vs Investment Management
To better understand the concept of an Investment Logic Map and its place in your decision making, it’s useful to understand how the creators of the ILM differentiate the concepts of Project Management and Investment Management. The table below gives an overview of the questions answered by the different practices in the investment process:[11]
| Investment Stage | Investment Management questions | Project Management questions |
|---|---|---|
| Planning | Is the logic for the planned investment clear? Is there a sound case to invest? Have we defined the best solution? Have we considered how to respond to uncertainty? |
Do we have the resources to deliver the solution? Do we understand risks to project delivery? |
| Delivery | Does the problem still exist and do we still care about it? Do we need to reassess how we measure benefit delivery? Do we need to re-shape the investment to respond to exogenous changes or increased uncertainty? |
Will the project complete within budget? Will it deliver to its planned schedule? |
| Evaluation | Were the intended benefits delivered? | Were the expected products or services delivered? |
Method
The Investment Logic Map is mostly defined during one or more facilitated workshops. Some refinement, reviews, and approvals are also done outside of the workshop structure but the vast majority of the work is done during the workshop.
All of the versions of the Investment Management Standard before the 2017 version mandated a single workshop with a two-hour time limit for the creation of the Investment Logic Map. Two hours was thought to be short enough to obtain the time commitment of senior people, and long enough to extract an agreed investment story.[4] There was also a stated belief that if the Investor (see Roles below) could not sufficiently identify the issue and a compelling need for investment during a two-hour facilitated workshop, then the compelling need for an investment should be questioned.[3] Additionally, all supplemental work done outside the workshop such as refinement and approvals should be completed no more than 48 hours after the completion of the workshop.[4]
However, with the lessons learned over the different versions of the IMS and the greater focus on risk and uncertainty included in the 2017 revision, the two-hour total and single meeting restrictions were removed and now the goal of completing the ILM in a single workshop is the exception rather than the rule.
While each workshop is still expected to take roughly two-hours, the new guidance provides different expectations for how many workshops there will be and what the workshops will achieve based on the level of complexity of the investment. These expectations are summarized in the table below:[12]
| Simple Investment | Medium Investment | Complex Investment | |
|---|---|---|---|
| 1st Workshop | Set the Scene Gather Issued & Identify Themes Unpack Problems Rank & Weight Problems Determine Benefits & KPI’s Determine Preferred Response and Interventions Outline Recommended Solution – Changes & Assets Finalize Workshop |
Set the Scene Gather Issued & Identify Themes Unpack Problems Rank & Weight Problems Determine Benefits & KPI’s |
Set the Scene Gather Issued & Identify Themes Unpack Problems Rank & Weight Problems |
| 2nd Workshop | Not Needed | Determine Preferred Response and Interventions Outline Recommended Solution – Changes & Assets Finalize Workshop |
Determine Benefits & KPI’s Determine Preferred Response and Interventions |
| 3rd Workshop | Not Needed | Not Needed | Outline Recommended Solution – Changes & Assets Finalize Workshop |
Of course, these expectations are not in stone and rather are provided so that expectations can be set among the participants on what a realistic timeline might be.
Ideally the workshop will consist of 6-8 total participants, with an upper maximum of 15 participants being recommended.
Roles
The Investment Logic Mapping (ILM) process includes three specific roles. Those roles are:
Facilitator: The facilitator’s role is to help the participants develop the most compelling, evidence-based case for investment that they can.[2] Specifically, the facilitator is expected to: [2, 4]
- Extract and tell the investment story in a way that will maximize its value to the organization
- Obtain agreement from all participants on the investment story that is told by the ILM
- Ensuring that each statement in the ILM is supportable by evidence by challenging the assumptions and claims made by the Investor and Participants
Investor: The Investor is the person who has identified the problem or opportunity. They are expected to make or advocate for the investment decision, and who will be ultimately responsible for delivering the benefits. This is roughly the equivalent of a project Executive Sponsor.
Participant: All of the other attendees of the workshop are classified as ‘participants’. They are there to assist the investor in understanding the problem, defining the problem, and who can provide evidence that the problem is real.[11] They will also be asked to help identify the objectives needed to respond to the problem, the expected benefits from addressing the problem, and the possible organizational changes needed to achieve the benefits.[2]
They are selected to participate because they have the most knowledge of the problem and its impact; because they are stakeholders who will be important in making the potential investment; or because they have an awareness of broader strategic policy areas of the organization.
History
The Investment Logic Map is the first artifact created under the Investment Management Standard (IMS) defined by the Australian State Government of Victoria - Department of Treasury and Finance. Aspects of the IMS had been evolving since 2004 within the state government, and they were formalized into the Investment Management Standard in 2007.
The IMS was initially created to support decision-making for information and communications technology (ICT) initiatives, but has since been expanded and applied to any investment decision made by the state government.
The process has been under continuous improvement since that time and has been adopted by other Australian entities, as well as the government of New Zealand. The versions of the standard and when they were in effect are identified below:
- Version 1 – Used between January and March 2007
- Version 2 - Used between April 2007 and March 2008
- Version 3 - Used between June 2008 and March 2009
- Version 3.5 - Used between April 2009 and November 2010
- Version 4 – Used between December 2010 and July 2012
- Version 5 - Used between July 2012 and May 2017
- Standard 2017 – The current version of the standard issued in May 2017
The Investment Logic Map is first of four documents that come out of the IMS process. The other three documents are all created after the ILM and are the: [4]
- Benefit Management Plan: A short document that specifies the benefits an investment will need to deliver to successfully address an identified problem. It includes the measures to be used as evidence that the benefits have been delivered. These measures are initially used to select the most suitable response to the problem. The benefit management plan also defines the dates the benefits are expected to be delivered, who is responsible for their delivery and how they will be reported.
- Strategic Options Analysis: A document that explains the logic used to identify which strategic response would best address the identified problem and deliver the expected benefits. This will describe the strategic interventions that were considered, how these were grouped to form a range of strategic options and why the preferred option was selected.
- Investment Concept Brief: A two-page document that depicts the logic underpinning an investment and identifies the likely costs, risks, dependencies and deliverables of the proposed solution. It is used to summarize the merits of an investment and so allow decision-makers to priorities competing investments before proceeding to a business case.
Those other documents are not part of this wiki page and may be covered in the future. However, I do not believe that the ILM must be followed by those other documents to be of use.
Why do it?
The best answer to this that I have comes straight from the Investment Management Standard:
Most organizations have adopted the business case as the way that potential investments articulate and justify the case for an investment. In common practice, business case documents have a strong focus on the solution that is planned to be delivered. However, they often fail to adequately describe the problem, explore the strategic options or specify the benefits that the investment will produce.
[4]
How do I do it?
Step 1 – Set up the Workshop(s)
The first step in the Investment Logic Mapping process is to set up the workshop. This includes identifying participants, identifying an appropriate 2-hour block of everyone’s time, identifying a location to have the workshop, and scheduling the session on everyone’s calendar.
It is the Investor’s responsibility to identify the Participants who should attend the workshop and they should provide the facilitator with initial information such as the names (and preferably relevance) of the participants; as well as the scope and intent of the investment.
Typical participants for a Problem Definition workshop might include:[12]
- the investor;
- senior executives with strategic responsibility for relevant operational areas;
- line managers with good understanding of the key issues;
- Chief Financial Officer/Chief Information Officer/Chief Strategy Officer or other senior staff who have an overarching view of organization and understand any relevant independencies;
- representatives from other organizational groups or partners who might have interdependencies, or other critical external stakeholders;
- technical specialist with detailed knowledge of services, systems and/or implementation;
- project or program management specialists who may be involved or who might facilitate the overall effort; and
- a business case developer, (if already identified), who can attend, as an observer, to learn more about the potential investment.
The Facilitator should work to:[12]
- Ensure the Investor directs all participants to make themselves very familiar with any existing relevant materials such as: briefing papers, background reports, external reviews, internal management reports etc.; and
- Assist the Investor to identify those participants who are the owners of key evidence and ensure that they can refer to it authoritatively during the workshop, when required. A key part of this workshop is to confirm that evidence exists to substantiate the problem(s).
- Ensure that the roles and responsibilities of participants are clear and identify the depth of understanding they should have of the issues. The workshop is very time-constrained and cannot become a forum in which issues are explained in detail to participants;
This basic information should be provided to the participants before the workshop.
Lastly, a venue needs to be identified and reserved that can accommodate the number of participants comfortably and which has at least one suitably sized whiteboard.
Step 2 – Set Expectations
Once the workshop gets underway, the facilitator should set some expectations. These may include: [2]
- Set the context and objective of the workshop, the roles of each participant, the approach, the time criteria and your role
- Handing out an example Investment Logic Map and discussing it quickly if participants are not familiar with the process
- Identify the conceptual level you want to create an Investment Logic Map at (Initiative, Program, Organization)
- Request that phones be off, no one multi-tasks, and that everyone pays attention
- That there likely will not be enough time to get the wording of the ILM exactly right, and that the facilitator will work with the Investor after the meeting to create a more polished version that will be distributed to all of the participants for comments and approval
- That everyone should feel free to challenge any statements or assumptions, and that the facilitator in particular will be actively doing this.
Additionally, the Investor should identify the overarching organizational outcome they want to achieve from the investment. This outcome should be written at the top of the white board and should act as the initial title for the Investment Logic Map.[12]
Step 3 – Problem Identification
Once the expectations have been set, the next step is for the Investor to outline the driver(s) that have caused them to consider an investment. According to the IMS, this typically takes 3-4 minutes.
Once the Investor has finished, the whole group should proceed to ask questions and expand upon the identified driver(s) and their context in order to build a shared understanding among all of the participants. This is a critical step because it both defines and builds consensus on the specific external forces that are causing an investment to be considered. This builds a shared frame of reference among Participants that will drive the rest of the process.
All of the drivers identified as contributing to the need for an investment should be documented on a whiteboard or similar location where they visible to all workshop attendees. The drivers are NOT placed in the ILM matrix at this time, but are rather kept off to the side and visible to all participants as a reference.
Once the list of drivers is complete in the opinion of the attendees, the list should be organized by general issue or category.
Step 4 – Identify & Weight Issue Statements
Using the drivers that were identified in the last step, the workshop attendees should start to define the specific issues (either problems or opportunities) that the investment is intended to address. These issue statements may be derived through root cause techniques such as Five Why’s or through general discussion amongst the attendee’s.
The IMS guidance indicates that there should be no more than 4 issue statements for a given initiative, and that in most cases two to three are sufficient. You should remember that the Investment Logic Map is meant to be a high-level document and these issue statements will guide the scope of the subsequent effort. One issue statement at this level may encompass such a wide field that the necessary change initiative could be at the organizational or program level, with multiple project-level initiatives below it.
The following are key questions that will help the attendees craft good issue statements: [2]
- What is the cause and what is the effect or consequence?
- What are the imperatives for this investment?
- What will happen if we do nothing?
- What trigger has made us think that we need to respond now?
- What is the effect or consequence that we really care about and can we do something about remedying the cause or what is broken?
- What evidence is there to support the relationship between the cause and the effect that we care about?
In the end, all issue statements should share the following characteristics: [2]
- Encompass both a cause and effect in a single statement (for example “High levels of water toxicity the park [the cause] threaten the presence of rare flora and fauna in the park [the effect]”)
- Be supported by evidence that verifies both the issue and effect (COMMENT: At least enough for the investment decision to seem logical and supportable; more detailed or robust evidence can be gathered later and included in the business case if the initiative moves forward)
- Be expressed in common language (e.g. Nothing too technical. Remember the goal that the ILM should be easily understandable a layperson).
Once you have created the 1-4 issue statements for the initiative, they should be weighted. The weightings of all identified issues in the ILM should add up to 100% with the group assigning weights based on importance and impact.
Generally, any issue that is assigned a weighting of 10% or less should probably be removed from the ILM as the idea is to focus on the issue that matter that most.
Lastly, no two issues in the ILM should have the same weight value. This forces the attendee’s to rank all of the problems in an ordinal manner.
Step 5 – Identify Benefits
Once the primary issues have been identified and weighted, the next step is to define the benefits that will be delivered to the organization, its stakeholders or its customers as a result of the investment.
The following are key questions that will help the attendees craft good benefit statements: [2]
- What value will we get out of this investment and how will we know whether value has been delivered?
- What benefits will the organisation expect in successfully responding to the problem?
- What outcomes will we get from remedying this problem?
- What benefit will government and citizens get from this investment?
- What part of the government agenda will this investment support?
- What KPIs will demonstrate value and are outcome focused?
And in the end, all benefit statements should share the following characteristics: [2]
- the benefits remove or mitigate the defined issues and are aligned to the outcomes valued and articulated by the organisation
- it is supported by two KPIs that are meaningful, measurable and attributable to this investment
- it is cost-effective – the effort required to track the benefit and the KPIs are commensurate with the value and insight that they provide to the organization
As each benefit statement is defined, a link should be made from each issue statement to at least one benefit statement that would result from addressing the issue identified in the issue statement.
At least one benefit statement should be crafted for each issue statement that was created in the prior step. If no benefit can be identified from addressing the issue, the issue should be removed from consideration or restated in such a way that benefits can be defined.
Additionally, each benefit statement must be supplemented by key performance indicators (KPI’s) and target measures for those KPI’s that will show that the benefit has been achieved. It is critical any benefits claimed are supported by reasonable KPIs – ones that are meaningful, attributable and measurable. These KPIs should be outcome focused, rather than output or activity focused. The emphasis should be on the results or impact of the work that is done to deliver the benefit and address the issue. [2]
You should aim for a maximum of four benefits and a maximum of two KPIs for each benefit. [2]
Lastly, each benefit should be weighted in the same way the Issues were waited.
Step 6 – Define Strategic Interventions
A strategic intervention is a high-level strategic action that could be taken as a response to an identified problem.[2] To be valid, a strategic intervention must have the potential to deliver some or all of the identified KPIs and their target measures. And to ensure a strategic intervention is of sufficiently high level, its implementation must also allow more than one possible solution.
Therefore a good strategic intervention needs to pass three tests. It must: [2]
- deliver some of the identified KPIs, their measures and targets;
- allow more than one possible solution; and
- be a valid response to the issue(s).
Generally, most strategic interventions are likely to fall within one of three general categories. Those are: [2]
- Demand changes – Can you stop, slow, divert (for negative demand) or increase (for positive demand) demand for resources or products
- Productivity changes – Can you improve productivity in ways that relate to the benefit(s)
- Supply changes – Can you increase it, fix it, make it cheaper, etc.
Note that these categories can attack the same issue from different directions. For example, if you have an issue where your organization is struggling to fulfill commitments on time due to a resource-constrained activity of some sort; you might look at options that reduce the demand for that activity, increase the productivity of the resources who undertake the activity, and add more resources to the group that undertakes the activity.
The following are key questions that will help the attendees identify good strategic interventions: [2, 12]
- What options are available to manage demand? For example, if we want limit or reduce demand are there options for charging more, rationing, or qeueing?
- What options are available for increasing productivity?
- What options are available for changing supply in a way beneficial to solving the problem?
- Is it within our power or influence to respond to this?
- Have we thought ‘outside the box’ in considering options?
- Have we got the right people here to answer this? Do we need to invite others into this conversation if we are genuinely going to deliver on the proposed KPIs?
- Does this align with the purpose of our organisation(s)?
- Do we need to involve another organisation and develop a joint response?
A minimum of four and a maximum of eight strategic interventions is likely as you try to determine the best strategic response. Ultimately you will select a combination of one to four interventions to form the strategic response.
And again, each strategic response should be weighted in the same way the Issues were waited.
Step 7 – Outline the Recommended Solution
Once a range of potential strategic interventions has been defined, the next step is to define the Changes and Assets that will make up the recommended solution that the investment will implement.
Changes are the things that must be done by the organization if the expected benefits are to be delivered and each Change must align with at least one strategic intervention.
Assets are any physical items that must be acquired to enable the identified Changes to occur. Examples of assets include technology, infrastructure (such as roads and hospitals), machinery, and buildings. Each Asset must align with at least one Change.
According to the Victoria government, most investments have between 4 and 6 changes and between 0 and 4 assets. Going beyond this tends to make the ILM too complex to understand and evaluate.
The following key questions have been provided in order to identify potential Changes and Assets:[12]
- What changes are needed in the way we operate? What do we need to do differently?
- What do we need to modify, build, buy or lease to implement our changes?
- Do these changes align with our interventions?
- Are there any orphaned interventions?
- Will the changes and assets proposed deliver the benefits and KPI’s previously defined?
- Are there any orphaned problem statements or benefits?
- Is this approach feasible?
Unlike the prior steps, Changes and Assets do not need to be weighted.
Step 8 – Finalize Workshop
Once the steps above are complete there should be a completed draft of the final Investment Logic Map. And based on that map, there are three possible outcomes from the ILM workshop. These are:[12]
- The participants like what they see (validation that the idea has merit)
- The participants don’t like what they see (seemed like a good idea at the time but we don’t see a good enough story to move forward)
- The participants couldn’t define a coherent story (we don’t know enough about the problem to consider investing now)
If option 2 is the outcome, the workshop achieved a useful result and the investment consideration will be stopped.
If option 3 is the result, the participants should decide if further investigation is warranted. Idea for further investigation may include bringing in other participants who know more (this may include outside specialists such as consultants who can provide greater knowledge of the issues and factors involved); as well as more investigation by the Investor to better understand the investment option.
Lastly, if option 1 is the result the process moves forward with:
- The Facilitator advising participants that a cleaned-up draft will be distributed in a formal ILM format to them within 24 hours.
- The Facilitator will include any observations of the ILM draft on its strengths and weaknesses and how it might be improved when it is distributed.
- Participants then have another 24 hours after distribution of the draft to provide any feedback upon the draft.
- The Facilitator and Investor will agree upon any feedback to be incorporated and a
Version 1.0
of the ILM will be created. - Within 24 hours after the feedback period is over, that
Version 1.0
will be distributed as the final output of the ILM workshop to all Participants.
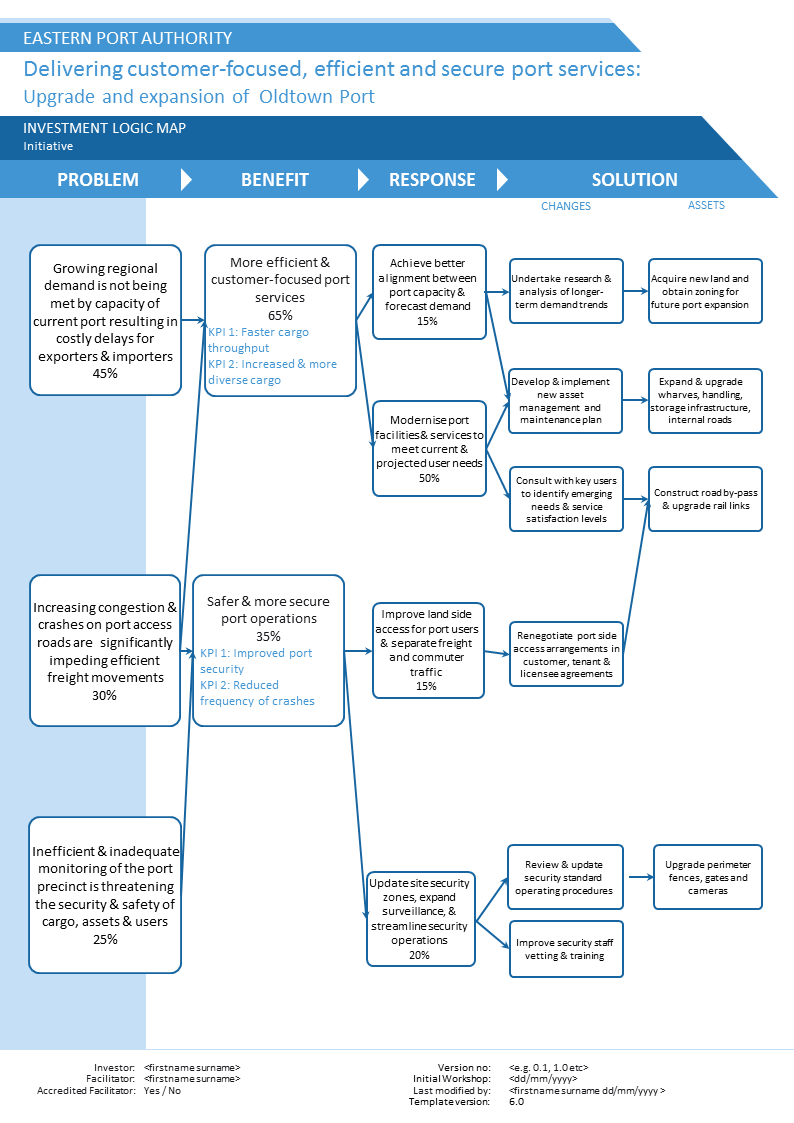
What Should the Results be?
The image below is one of the ILM examples provided by the Victoria Government and represents what a completed ILM might look like:
Advantages
- The Investment Logic Map process is designed to be engaging to senior decision-makers by being quick, simple, and narrowly focused.[3]
- The ILM forces those advocating for an investment to do enough research and analysis on their proposed investment, its drivers, and its outcomes that they can drive the creation of a compelling investment story in a short amount of time.
Disadvantages
- One of the main disadvantages of the ILM is that it by necessity mandates a very short chain of causality. This means that weaknesses in the logic may go unnoticed.[3] However, remember that the ILM is intended to act as a sort of ‘first hurdle’ in the process of making an investment and is not the last stage of evaluation. The standard mandates that the final business case
must robustly test these assumptions and provide options for managing them
.[11] Ultimately, whether an investment proposal gets to move on to the next stage of development comes down to a ‘gut-feel’ judgement on the part of the investor about whether the story told by the ILM is a convincing one.
[3]- Given that the identified KPI’s are intended to be used to measure the success of the investment and the short time that workshop attendees have to identify them, they may lack sufficient relation to the benefits and interventions identified to be reliable.[3] Thus the knowledge of the participants and the clarity of the logic chain told by the investment story are critical.
Tips
- None at this time.
References
IMPORTANT NOTE: The ILM process has been undergoing changes over the years and so has the Government of Victoria website. Unfortunately, this means that many of the links below may stop working suddenly. I have found if a link does stop working that you can just go to the Government of Victoria website and search for Investment Logic Map
or Investment Management Standard
and you will be able to find most of these documents.
- Document: ICT Guideline – Investment Logic Map. By the Government of Victoria – Chief Information Officer. http://www.blisslogicaccountants.com.au/wp-content/uploads/2012/11/INVESTMENT-LOGIC-MAP.pdf
- Document: Facilitator tips and traps – Problem definition workshop. By the Victoria State Government Department of Treasury and Finance. 2012. http://www.dtf.vic.gov.au/Publications/Investment-planning-and-evaluation-publications/Investment-management/Facilitator-tips-and-traps
- Research Paper: An examination of the value of the Victorian Government’s investment logic map as a tool for front-end evaluation of investment proposals. By Aaron Doty. Evaluation Journal of Australasia. 8, No. 1. Pgs 26-39. 2008. http://www.aes.asn.au/images/stories/files/Publications/Vol8No1/AESJ%20v8%20no1.pdf
- Document: Investment Management Standard version 5. By the Victoria State Government Department of Treasury and Finance. 2012. http://www.dtf.vic.gov.au/sites/default/files/2018-03/Investment%20Management%20Standard%20version%205.doc
- Investment Logic Map Example - Initiative. By the Victoria State Government Department of Treasury and Finance. 2012. http://www.dtf.vic.gov.au/sites/default/files/2018-02/Noojee%20-%20Investment%20Logic%20Map%20-%202017_0.pptx
- Document: Investment Logic Map Example – Organization. By the Victoria State Government Department of Treasury and Finance. 2012. http://www.dtf.vic.gov.au/Publications/Investment-planning-and-evaluation-publications/Investment-management/Investment-logic-map-example-Organisation
- Document: Investment Logic Map Example – Program. By the Victoria State Government Department of Treasury and Finance. 2012. http://www.dtf.vic.gov.au/Publications/Investment-planning-and-evaluation-publications/Investment-management/Investment-logic-map-examples-Program
- Document: Initiative Investment Logic Map Template. By the Victoria State Government Department of Treasury and Finance. 2012. http://www.dtf.vic.gov.au/Publications/Investment-planning-and-evaluation-publications/Investment-management/Investment-logic-map-template-Initiative
- Document: Organizational Investment Logic Map Templates. By the Victoria State Government Department of Treasury and Finance. 2012. http://www.dtf.vic.gov.au/Publications/Investment-planning-and-evaluation-publications/Investment-management/Investment-logic-map-template-Organisational
- Document: Program Investment Logic Map Templates. By the Victoria State Government Department of Treasury and Finance. 2012. http://www.dtf.vic.gov.au/sites/default/files/2018-02/IMS%202017%20Investment%20Logic%20Map%20Template%20Initiative.pptx
- Document: Investment Management Standard 2017 Departmental User Guide. By the Victoria State Government Department of Treasury and Finance. 2017. http://www.dtf.vic.gov.au/files/ef150c21-f78a-47ec-9062-a77d00d76349/Investment-Management-Standard-Departmental-User-Guide-Final-May20172.docx
- Document: Investment Management Standard 2017 Technical Guide for Facilitators – Problem Definition Workshop. By the Victoria State Government Department of Treasury and Finance. 2017. http://www.dtf.vic.gov.au/sites/default/files/2018-02/IMS%20Technical%20Guide%20for%20Facilitators%20Problem%20Definition%20Workshop.docx
Other Resources
- Web Page: What is the Investment Management Standard? By the Victoria State Government Department of Treasury and Finance. Accessed on July 15, 2016. http://www.dtf.vic.gov.au/Investment-Planning-and-Evaluation/Understanding-investment-planning-and-review/What-is-the-investment-management-standard
- Document: Investment Logic Mapping (ILM). By the State Services Commission of the Government of New Zealand. http://www.ssc.govt.nz/sites/all/files/ILM-Introduction-Briefing.pdf
- Blog Post: Building on the Investment Logic Map for More Rigorous Front-End Programme Evaluation. By Aaron Doty. https://morgoth.wordpress.com/tag/investment-logic-map/
- Web Site: Guide to the investment planning process. By the Victoria State Government Department of Treasury and Finance. Accessed on July 19, 2016. http://www.dtf.vic.gov.au/Investment-Planning-and-Evaluation/Understanding-investment-planning-and-review/Guide-to-the-investment-planning-process
- Document: Investment Logic Map – Quality Assessment Form. By the Victoria State Government Department of Treasury and Finance. 2012. http://www.dtf.vic.gov.au/Publications/Investment-planning-and-evaluation-publications/Investment-management/Investment-logic-map-quality-assessment-form
- Document: Investment Logic Map – Investor Feedback on Facilitator Form. By the Victoria State Government Department of Treasury and Finance. 2012. http://www.dtf.vic.gov.au/Publications/Investment-planning-and-evaluation-publications/Investment-management/Investor-feedback-form
- Document: Investment Logic Map – Fictional Initiative Examples. By the Victoria State Government Department of Treasury and Finance. 2012. http://www.dtf.vic.gov.au/Publications/Investment-planning-and-evaluation-publications/Investment-management/Fictional-initiative-investment-logic-maps
- Document: Investment Management Standard 2017 update – Frequently Asked Questions. http://www.dtf.vic.gov.au/files/b2162f89-c81e-439e-ae94-a77d00b234ed/Investment-Management-Standard-2017-update-Frequently-Asked-Questions.docx