Decision Trees
What is it?
Decision tree's are one of the core
Business Analysis techniques, showing up as part of section 9.8 (Decision Analysis) of the BABOK Guide v2.0. As with so many business analysis techniques, how you define it seems to depend on who you ask; as I have come across all of the following definitions for a decision tree:
- A decision tree is a chronological representation of the decision process. [1]
- A decision tree is a two-dimensional graphic representation of the decisions, events, and consequences associated with a problem.
- A decision tree is a classifying tool used by management in an organization to make a decision. [3]
- A decision tree analysis is a management tool used to analyze the economic viability of multiple courses of action among which the organization can choose at a particular juncture in time. [4]
- A decision tree is an arrangement of tests that provides an appropriate classification at every step in an analysis. [6]
And there are probably other definitions I have not come across yet. The key take-way is that decision trees are a model of the decisions and options to be taken to reach a specific answer (or decision).
As is also common with widely used modeling techniques, there are a number of symbols that are used by different authors. But in general, decision trees are made up of the following elements:
Why do it?
According to the Principles of Management
, the primary purpose of a decision tree is to have a defined set of rules that allow you to explain the conclusions drawn from the decision tree.[3] But they are also an easily understandable way to represent the possible options and results that could come from a decision. In general I see them used for three different purposes. Those are:
- Evaluating a business choice such as which investments to make
- Showing the logic behind a decision
- Categorizing data in order to extract a sub-set.
Business Analyst's are most likely to use them when presenting solution options to decision makers or when diagramming the logic to be automated in an application.
How do I do it?
In the example below I will show how to build a simple decision tree that evaluates the options (in a very simplified way) for making a decision to replace the current Sales CRM (client-relationship management) application with a newer, more efficient option. And yes, I know the figures below are wildly unrealistic. {grin} They are simply used for illustrative purposes.
Step 1
Decision Tree's are read from left to right, so the first step is to place the root decision node on the left.

Step 2
The next step is to add the four choices that have been defined as possible project solutions. They are a cloud-based hosted CRM (we'll call it SalesForce as an example); an installed in-house CRM (we'll call it Siebel as an example); a custom in-house built CRM (that we'll call Our CRM as an example) that heavily intregrates with existing systems for maximum benefit and tailoring to our existing sales process; and doing nothing. So we add the four options to the diagram.

Step 3
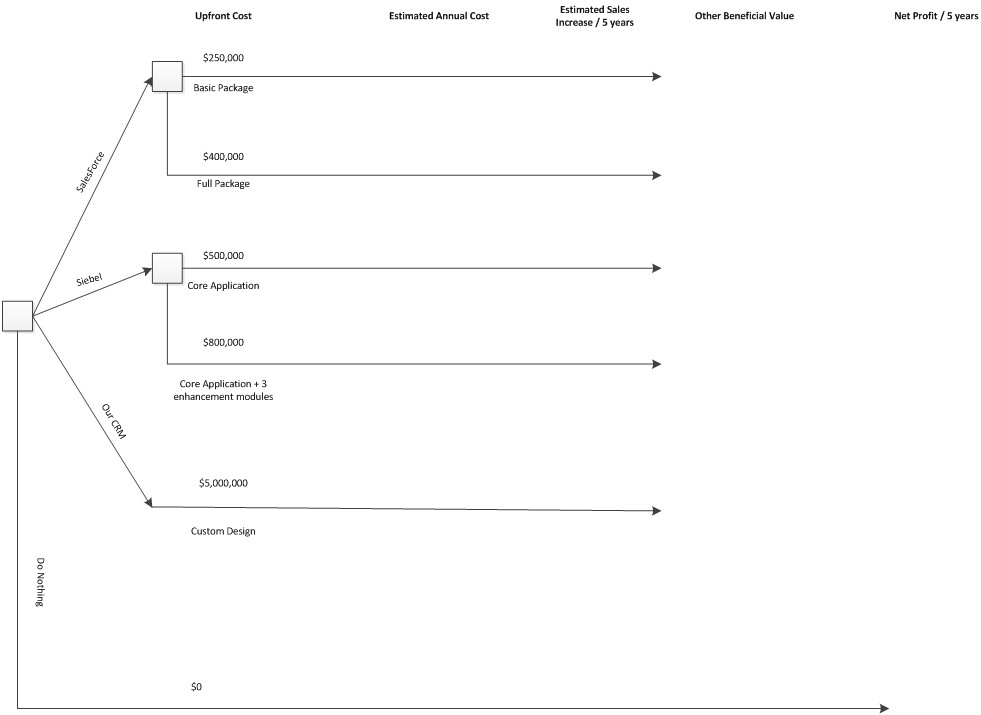
As part of the evaluation we are going to include estimated figures we have on the following decision points:
- Upfront cost - how will it cost us to get going on the solution, including initial development costs)
- Estimated Annual costs - how much do we expect it to cost us each year to support the new solution)
- Estimated Sales Increase - how much do we expect sales go to up over a 5-year period from the new solution)
- Other Beneficial Value - How much other beneficial value can be gained from synergies the new solution offers with existing applications and processes
- Net Profit / 5 years - based on the previous factors, what do we expect the net profit from the decision to be after 5 years.
We are also going to explore a couple of options for the two COTS packages.
- For
SalesForce
we are going to consider aBasic
package with just the core features (which can be upgraded later) and aFull
package with additional components. - For
Siebel
we are going to consider aCore
application with just the core CRM module and another scenario where in addition to the core CRM functions we are adding in 3 enhancement modules (for example, for improved lead dissemination, a meeting scheduler, and an improved analytics module). - For the
Our CRM
we are going to include all the features our Sales department has identified that they want. This is thedream system
.
So for step 3 we are going to add "column" labels to the top of the diagram, and then extend the model to include the options discussed above. This results in a diagram that looks roughly like this:

Step 4
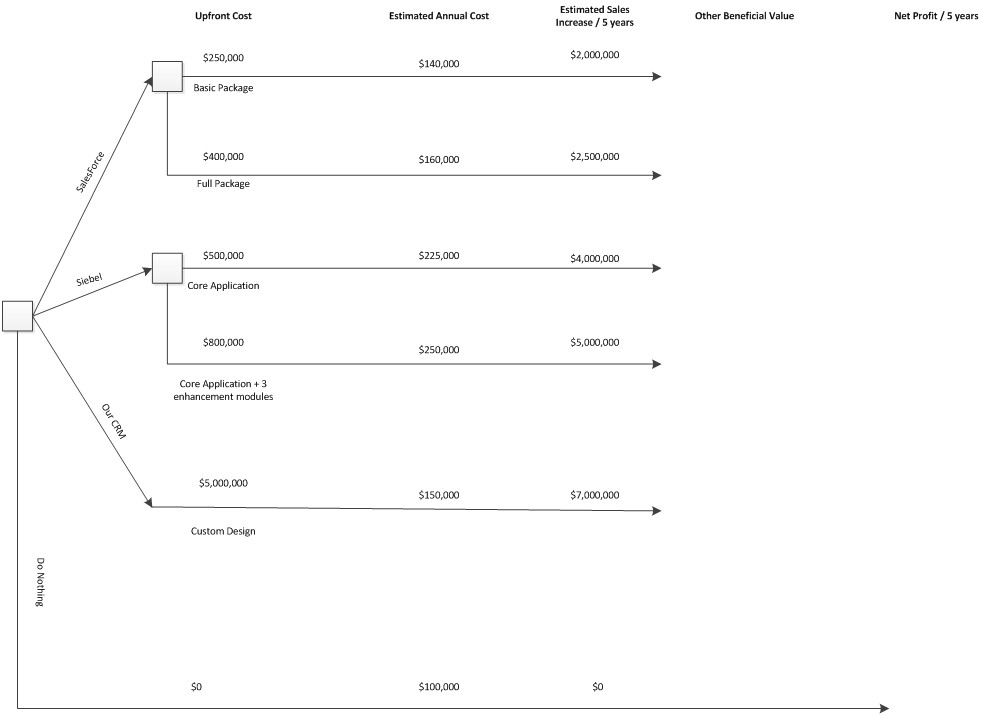
For the next step, we are going to add the estimates we have for the estimated annual cost for each option (maintenance and licensing) and the estimated sales increase that we expect over a 5 year period based on the functionality that will be deployed to the sales team.
The numbers are totally made up, the idea is that your analysis might find that:
- The
SalesForce
option is the least expensive to purchase and run, but the least customizable both now and in the future. While you may get the benefit of future upgrades immediately, they may not always be suitable for your Sales process. So while expected to improve your Sales results, you may not get as much benefit as you could from a more customizable solution. - The
Siebel
option is the next higher in cost as it is locally installed and requires dedicated servers and support staff. But because it is locally installed and managed, there are much greater options for customization (within limits) to best impact your Sales process. It will require additional training of your maintenance and support staff, so it has a higher yearly cost as well. - The
Our CRM
option has the massive upfront cost of development. But because you don't have to pay regular license fees, it can run in on existing hardware, and all the expertise will be built up in house, in has the lowest yearly cost option (not much more than the current annual costs).
When all of this is folded into the diagram it looks like this:

Step 5
For the beneficial value column (and Net Profit column for a few items) I am including the idea of probabilities in this diagram. You use these to show the best probability that a result will occur.

Step 6
In the last step we finish up the diagram by calculating the resulting values. The final value is calculated by adding or multiplying as necessary. So the very top value is calculated based on this formula: (-$250,000 + -$140,000) + $2,000,000 + *80% * $100,000) = $1,130,000.

What Should the Results be?
The diagram above in Step 6 represents an example of a business choice decision tree.
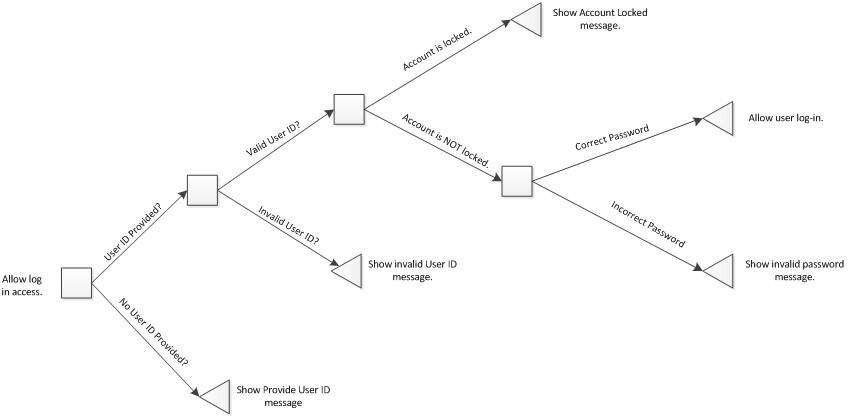
An example of a simple decision tree that shows the logic for a web site login process might look like the diagram below. Note that there are no uncontrolled steps in this decision tree:

Advantages
- They are a simple visual model that in can be very easy to understand when the decision structure is not too complex.
- Decision analysis may force stakeholders to honestly assess the importance they place on different alternatives. [5]
Disadvantages
- A decision tree for a more complex decision can get quite large. Making it hard to present and difficult to understand all of the options.
- Due to their potential complexity, in some cases they may be very difficult to update when slight changes in decisions or possible outcomes are made.
- Decision analysis requires specialized knowledge and skills, including mathematical knowledge, an understanding of probability, and similar concepts. [5]
- The results of decision analysis may be treated as more certain than they actually are, if decision-makers do not understand the limitations of the model and the assumptions [5]behind it.
Tips
- Keep in mind that the more complex the decision tree, the less powerful it will be as an effective means of communication. [3]
References
- Web site: Tools for Decision Analysis - Analysis of Risky decisions. By Dr. Hossein Arsham of the University of Baltimore. (see his web page for lots of decision science and related info: http://home.ubalt.edu/ntsbarsh/)
- Book Chapter: Chapter 57 - Decision Trees. From The Information System Consultants Handbook - System Analysis and Design. By William S. Davis and David C. Yen. 1998.
- Article: What Are the Weaknesses of a Decision-tree Analysis? By Matt McGew. eHow.com
- Blog Entry: Big Decisions Require a Decision Tree. By E. Steve Kim. January 15, 2013. On the E.S. Kim Enterprise Consulting Blog.
- BABOK Guide v2.0. Section 9.5. Decision Analysis. From the IIBA.
- Web Page: Overview of Decision Trees. By Howard Hamilton. Part of the online material for CS 831: Knowledge Discovery in Databases. University of Regina. 2012.
Related Resources
- Wikipedia entry: Decision Tree
- Article: Decision Trees. At MindTools.com
- Blog Entry: Requirements Models - Decision Trees and Decision Models, a Choose Your Own Adventure! Blog, part 1 of 2. By Candace Hokanson. At the Sielevel blog. July 2, 2012.
- Blog Entry: Software Requirements Model 2 - The Decision Tree. By J. Shideler. On the Sielevel blog. January 19, 2006.
- PDF: Decision Tree Primer. By Craig W. Kirkwood, Emeritus Professor at Arizona State University. 2002.
- Web Page: Decision Trees (data mining specific). At the Rudjer Boskovic Institute.
- Blog Entry: Business Analysis Technique - Decision Analysis. By Susan Weese. On the Learning Tree Perspectives on Project Management blog. July 4, 2010.

