Concept Map
This is only a mid-level overview of Concept Maps that applies them specifically to the world of Business Analysis. For detailed information, including research papers, background, and supporting software; please go to the archive of information on Concept Maps at the Institute for Human and Machine Cognition (where they were pioneered). Those web pages should be considered the ultimate resource for Concept Maps.
What is a Concept Map?
As described by their creators, Concept maps are graphical tools for organizing and representing knowledge."[1] More simply, concept maps are a way of showing the relationships between concepts within a domain of knowledge and how multiple concepts are interlinked to form a framework or foundation of knowledge in a specific domain
.
They were developed in 1972 during research by Joseph D. Novak at Cornell University in which he was trying to follow and understand changes in children's knowledge of science.[1] They were struggling to identify specific changes in children's understanding of science concepts through interviews, and came up with the concept map idea as a way of modeling children's understanding of concepts and relationships, and how it changed over time.
Concept Maps are comprised of three different elements, which are:
- Concepts
- A concept is defined as
a perceived regularity in events or objects, or records of events or objects, designated by a label
. Basically, it's just about any thing, term, or idea that exists within a regular structure or framework (it's not unique). In a concept map a concept is typically represented by a box or circle that encloses the label. - Linking Words
- Linking words or linking phrases specify the relationship that two concepts have to each other, if any. Linking words are indicated by an arrowed line leading from one concept to another, with a word or phrase on the line that indicate the type of relationship.
- Propositions
Propositions are some statement about some object or event in the universe
.[1] They are created by combining two or more concepts linking words to form a meaningful statement. Propositions, by demonstrating the relationship between two or more concepts, are the foundation of knowledge.
Why should I use Concept Maps?
Concept Maps have a number of uses in the Business Analysis domain, including:
Learning the Clients
Language
In combination with Glossaries, Concept Maps are among the best ways for a business analyst to learn the language
of a new client they are starting to work with, regardless of whether that client
is internal or external to their organization. Essentially, the glossary is used to understand the meanings of terms and concepts used by the client, while the concept map is used to understand the relationships between those terms and concepts.
Depending on the circumstances, you may want to create a glossary and concept map for each different business unit or client you work with so that you have documented the way they speak amongst themselves and can be sure to speak to them in the way they best understand.
Establishing a Consistent Project Language
Similar to learning the clients language, concept maps and glossaries are very useful in establishing a singular project language
that will be shared amongst all stakeholders involved in the project, so that everyone know what exactly is meant by the use of a term in a project document, meeting, etc. This is how glossaries are often described as being used in business analysis, and concept maps can supplement the glossary in documenting the official
relationship between terms for project use.
Eliciting Tacit Knowledge
Working with an SME to create a concept map related to their specific area of expertise is a great way to identify and elicit tacit knowledge they may have. By working with them to identify the concepts they use, the hierarchy of those concepts, and the various relationships among them and presenting that knowledge back in a visual way; the business analysis can help the SME identify gaps in the information they have provided and clarify unconscious knowledge of relationships.
Identifying Potential Requirements Dependencies
A well-constructed concept map can also help the business analyst in identifying potential requirements dependencies based on the relationships between the concepts. Especially concept relationships that span across sub-groups within the concept map. These relationships often point to business rules and functional dependencies that may not be obvious. And if nothing else, the identified relationships help the business analyst in planning their elicitation activities so that they are aware of potential dependencies and can dive into more detail when working with SME's and others.
How do I create a Concept Map?
Step 1 - Select the Domain / Question
The first step in creating a concept map is to select the domain of knowledge or specific question you are going to map. The creators of the concept map idea believe that every map should try to answer a specific question, and one way of doing this is to specify a focus question
, which clearly specifies the problem or issue the concept map should help to resolve.
However, I have found that just mapping a new knowledge domain can be a useful activity for business analysts itself. So you might decide to map the concepts and terminology commonly used by Business Team X or in support of "Business Process Y
. Just be clear on what it is you are mapping or your map will lose coherency of purpose and be less useful.
Step 2 - Identify the Key Concepts
The second step is to begin to identify the key concepts that apply to the domain being mapped. If you have started work on a Glossary, you can start with those terms. But if not, start off with trying to list as many terms and concepts that apply to the domain you are exploring as possible.
As an example, here is the list of terms I used for the Glossary wiki entry, which come from a project I am working on about Institutional Client Reporting that is still early in the concept phase (at the time of writing this):
3c7
3c11
Account
Ad-Hoc Report
Attribution
Batch Report
Benchmark
Caveat
Chart
Chunk
Client
Commentary
Commingled Trust
Consultant
Content
Data
Digital Asset
Fully Automated Report
Holding
Institutional Client
Institutional Vehicle
Investment Vehicle
Manual Report
Partially-Automated Report
Private Fund
Product
Report
Reporting Period
Retail Client
Retail Vehicle
Scheduled Report
Separate Account
SICAV
Static Text
Template
Triggered Report
U.S. Retail Fund
Step 3 - Order the Concepts
Once you have the initial list of concepts, try to re-order the list so that the most general concepts are at the top and the most specific concepts are at the bottom.
Client
Institutional Client
Retail Client
Account
Holding
Consultant
Investment
Product
Investment Vehicle
Benchmark
3c7
3c11
Commingled Trust
Institutional Vehicle
Private Fund
Retail Vehicle
Separate Account
SICAV
U.S. Retail Fund
Report
Ad-Hoc Report
Batch Report
Fully Automated Report
Manual Report
Partially-Automated Report
Scheduled Report
Template
Triggered Report
Reporting Period
Content
Chunk
Data
Attribution
Caveat
Chart
Commentary
Digital Asset
Static Text
Step 4 - Map the Most General Concepts
The creators of concept maps say they should be hierarchical in design, although I think that factors such as the amount of presentation space, the number of concepts, and complexity of concept links can sometimes make achieving a hierarchical design difficult.
However, before you start creating your concept map it is usually a good idea to decide what your primary or core
concept will be. This should be the highest concept in a hierarchical map, or is generally where you would want a reader of the concept map to start.
In the case of my example, the concept I am exploring is the Institutional Client Reporting
activity domain of my employer. Institutional in this case is a type of client, and so is more specific than the term Client
. Reporting is an activity, and is the primary activity being analyzed, but it is an activity that is done in response to a client. Based on that simple logic, I am going to start off with Client
as my primary concept.
Place your primary concept at the top and center of your work-space. If whatever mechanism you are using to create the map supports it, I like to color this primary concept with a green background to show it is the "starting point" of the map. But again, this is not part of the standard process defined by the creators of concept maps.
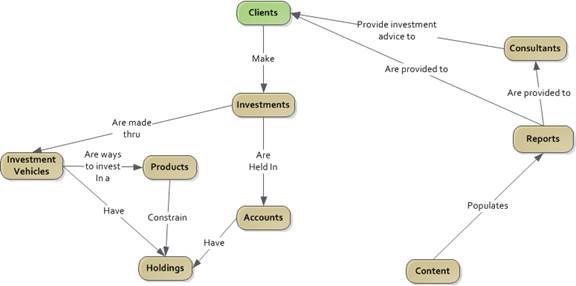
Next, add a second concept below it somewhere, and draw an arrowed line between the two. Then add text to the line that describes the relationship between the two the concepts. This linkage of two concepts by an arrow and relationship form a proposition (discussed above). The direction of the arrow should reflect the direction that the proposition should be read.
It is important to realize that almost any concept you are mapping can be related to any other concept you are mapping, because you are focusing on a specific domain or question. However, you should try to only map (at least initially) the most relevant and important relationships.
Taking the actions above results in a partial concept map like the one below.
Step 5 - Add More Detailed Concepts
The next step is to add more concepts to your map that are of a more specific, less generic, nature. You can generally do this in two ways:
- You can take each of the more generic concepts you started with and add the next level of more detailed concepts that relate them. This has the effect of incrementally expanding the concept map overall.
- You can take one of your generic concepts, and build out that "node" of the concept map until you can think of no more related concepts or relationships. This has the effect of significantly expanding one section of the concept map.
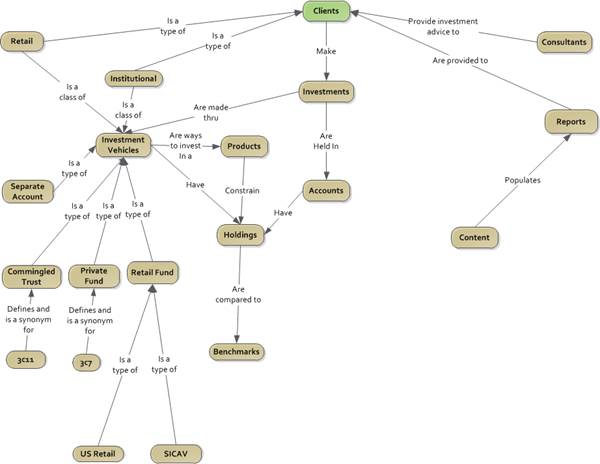
If you clustered your concept list into related groups like I did in Step 3 above, the second option is often the easiest next step. So in this example I am going to expand out the area of the map that relates to Product
since it is the largest group of concepts I created in Step 3.
One thing to be aware of at this stage is that the creators of concept maps say that examples of a concept in a map should not be in the same type of visual entity as a concept (for example, in the concept map below a Separate Account
is really just an example of an Investment Vehicle
and not necessarily a concept of its own, therefore it should not be contained in a rounded rectangle). I often don't follow that rule, but it's worth considering whether your concept map will follow that rule or not.
Step 6 - Add More Detailed Concepts, Again
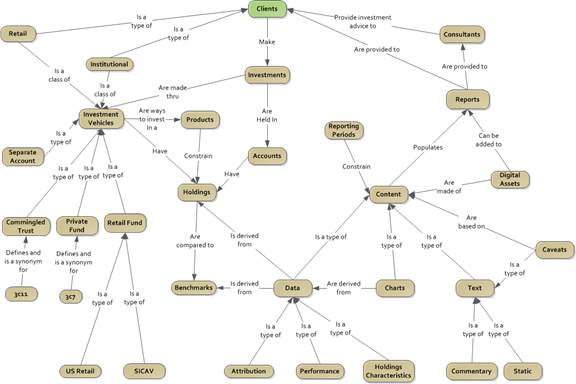
Repeat the same process you did in Step 5 above, but for a different generic concept. For this example, I am going to add more detailed concepts to the map that relate to the Content
concept.
Step 7 - Finish Adding All of Your Initial Concepts
As in the previous two steps, pick a generic concept that has more detailed concepts below
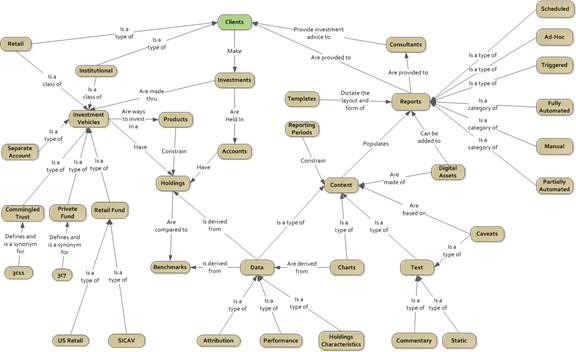
it and expand the map. In this example, I will now add the more detailed concepts that are related to the generic Reports
concept.
You would keep repeating this until you have added all of your initial concepts from the list in Step 3, but this will be the last of them from them for the example.
Step 8 - Revise, Revise, Revise
A concept map will probably never be final
. As you learn more, you will be able to add more concepts, more relationships between the concepts, improve the words used to describe the relationships, and change the layout of the map to make the overall map and the knowledge it represents easier to understand. The creators of concept maps say that in their experience, it usually takes at least 3 iterations of a map to achieve one that is "good". [1]
One thing to look for as you are revising your initial few drafts are for relational links that reach across the different sections, or clusters, of the map. These are usually non-obvious relationships that are often important.
What Should the Results be?
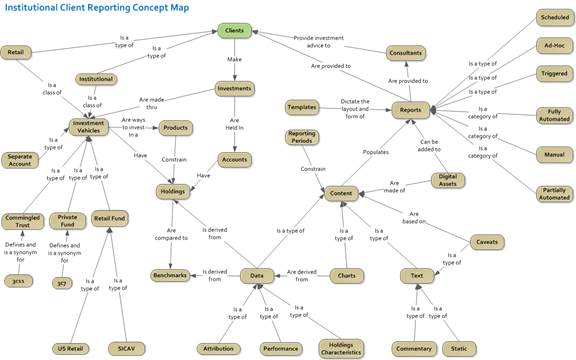
The final
result below adds a label to the overall concept map, but it otherwise the same as what was in Step 7 above. Please realize that this map is the result of working with just the 2 core groups of my project. We haven't even started with the various support teams and those business units that are further away from the core activity. As I work with those groups, the map will likely change even more, or I may end up creating several maps that focus on specific questions.
Another really good example of the final result should be is this Concept Map about Concept maps. For copyright reasons, I won't include the actual diagram.
But hopefully the example linked to above and the example below give you a good idea of how useful a relatively simple diagram like a concept map can be.
Advantages
- The idea behind Concept Maps is easy to understand.
- The process of creating concept maps is very easy for most BA's to adopt, because it is so similar to our normal analysis process of starting with more generic problems or needs, and then further refining those into more detail and looking for linkages between them (the process of defining requirements).
Disadvantages
- While you could create concept maps on a whiteboard or something similar, the frequent changes in layout and included concepts mean that you really should have some sort of diagramming software to create them.
- Because concept map represent an understanding of relationships, they are subject to misinterpretation or disagreement if the creator and reader have different definitions of a concept. Therefore, it is best to accompany a concept map with a glossary or similar document that specifies what is meant by a concept.
Tips
- Concept Maps are best utilized when accompanied by a Glossary that provides definitions for the Concepts. That way any reader also knows exactly what is meant by a Concept label.
- To create a concept map, try using Visio, Pencil, or a similar application with very basic diagramming capabilities.
- Concept labels should avoid being
sentences in a box
. If you can't label a concept with a 1-3 words, you probably need to break the concept down more. - If using a tool like Visio, it can sometimes be useful to use a representative icon for a concept rather than the standard box or circle that you would otherwise use. These can be useful in separating once concept from another, but may also distract from the relationship between concepts, which is the main point of the concept map.
References
- Research Paper: The Theory Underlying Concept Maps and How to Construct and Use Them. By Joseph D. Novak and Alberto J. Canas. A Technical Report for the Institute of Human and Machine Cognition (IHMC). 2006.
- Web Page: What is a Concept Map? By Joseph D. Novak and Alberto J. Canas. Last Update: Sept. 28, 2009
Related Resources
- Web Page: A Concept Map about Concept Maps. From the CmapTools web site at the Institute for Human and Machine Cognition.